3.3.3.1.5. Task Dependency Graph
- Configuration String:
NX_INSTRUMENTATION=tdgorNX_ARGS="--instrumentation=tdg" - Description: It generates a .dot file with all the real dependences produced in that particular execution.
This plugin also admit some extra parameters:
--node-size=<string> Defines the semantic for the node size. Configuration string can be:
constant: the size of all nodes is the same (default).linear: the size of the nodes increases linearly with the task time.log: the size of the nodes increases logarithmically with the task time.
This instrumentation plugin generates a dependency graph using Graphviz (http://www.graphviz.org) format.
When compiling with Mercurium, you will need to use the flag --instrument.
At runtime you will need to enable the tdg plugin using the environment
variable NX_ARGS="--instrument=tdg". The execution of the program will
generate graph.dot file, and also (if dot program available) a
graph.pdf file.
Dependences shown in the graph are real dependences, which means that are dependences that actually happen during that specific execution.
Usually one wants all the theoretical dependences in the program. To do this
you have to run your program with a single thread and ensure that the schedule
creates all the tasks (i.e. does not decide to immediately run them).
To achieve this use NX_ARGS="--smp-workers=1 --throttle=dummy", see example
below.
This version of the plugin is thread-safe, so you do not need to execute your program with a unique thread to draw the TDG (although it is recommended to draw properly your program dependences).
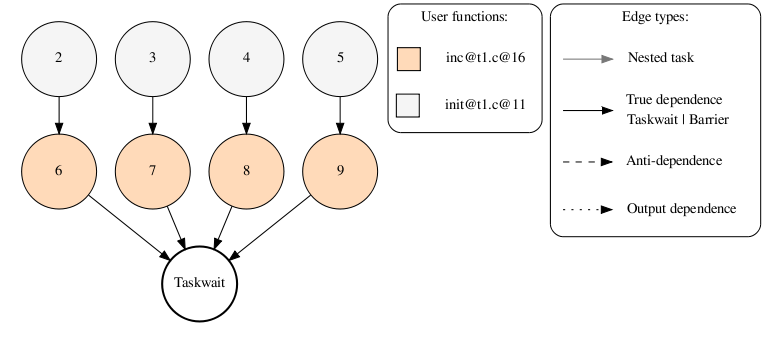
In the graph, task nodes are colored according with the function they represent
(the plugin includes a legend in the right-top part showing equivalence
between colors and functions). The size of the node may also represent time,
which means that bigger tasks are more time expensive than the smaller ones.
Finally the tdg plugin also shows two different kind of arrows. Solid arrows
are true dependences, while dashed arrows are used to specify anti/output dependences
as defined in the legend. Gray arrows show nested relationships.
3.3.3.1.5.1. Output Example
Running the following code with this plugin will produce the next graph:
int a[N];

for(int i=0; i<N; ++i) {
   #pragma omp task out(a[i]) label(init) firstprivate(i)
   a[i]=0;
}

for(int i=0; i<N; ++i) {
   #pragma omp task inout(a[i]) label(inc) firstprivate(i)
   a[i]++;
}

#pragma omp taskwait

for(int i=0; i<N; ++i) {
   printf("%d,",a[i]);
}
Command line:
$ NX_ARGS="--smp-workers=1 --throttle=dummy --instrumentation=tdg" ./myprogram